Digital Twin
Your asphalt plant in 3D, live, with every reading where it happens.
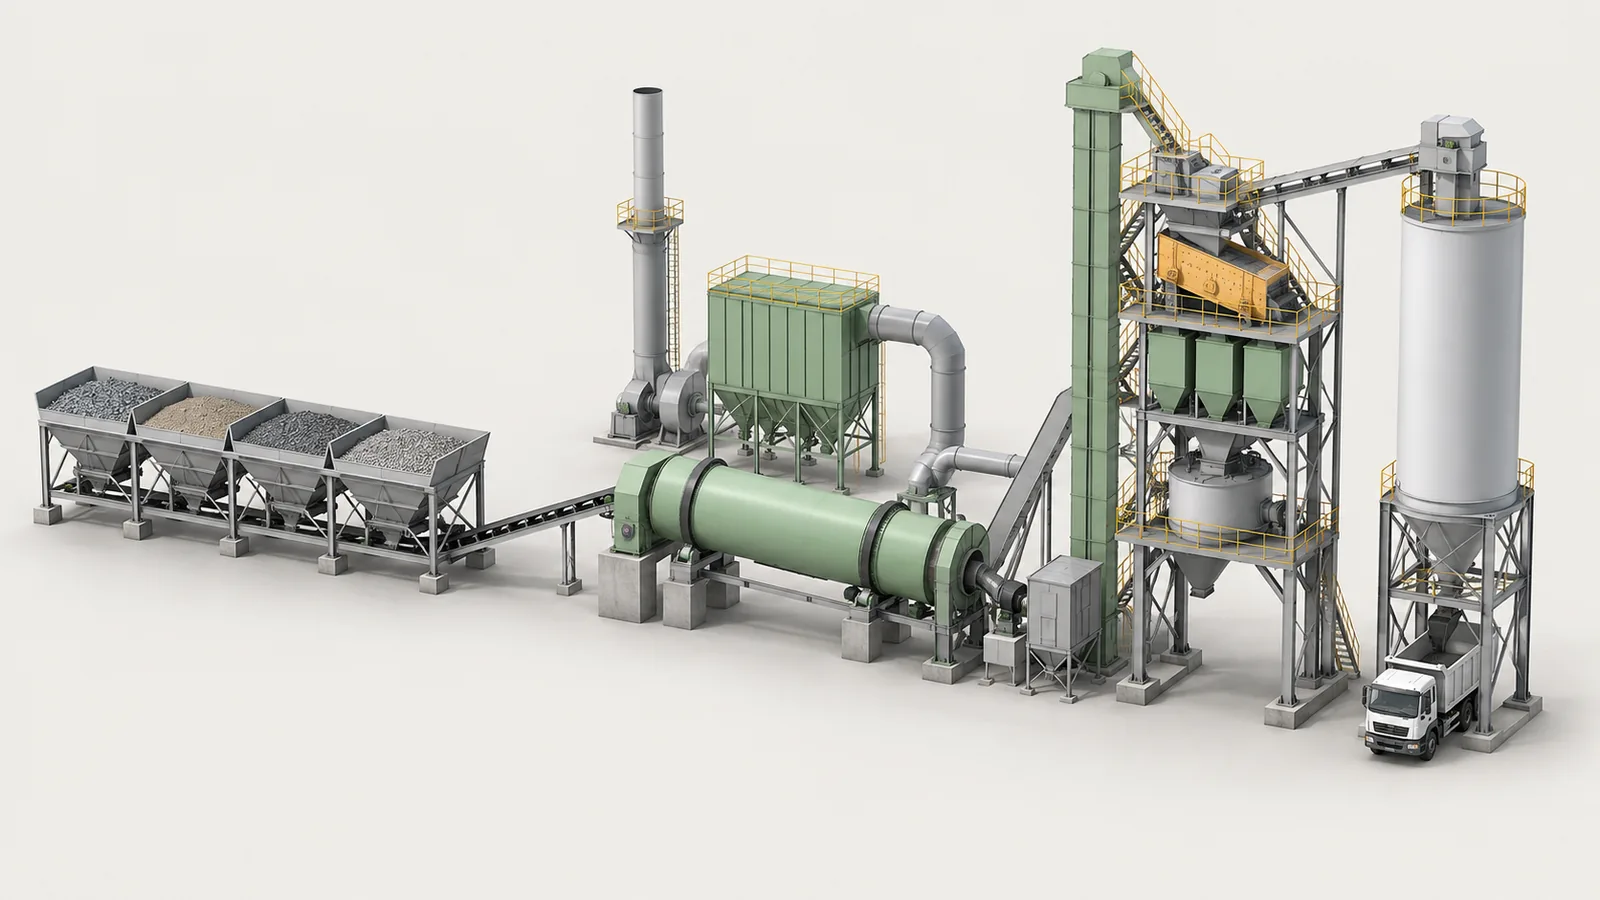
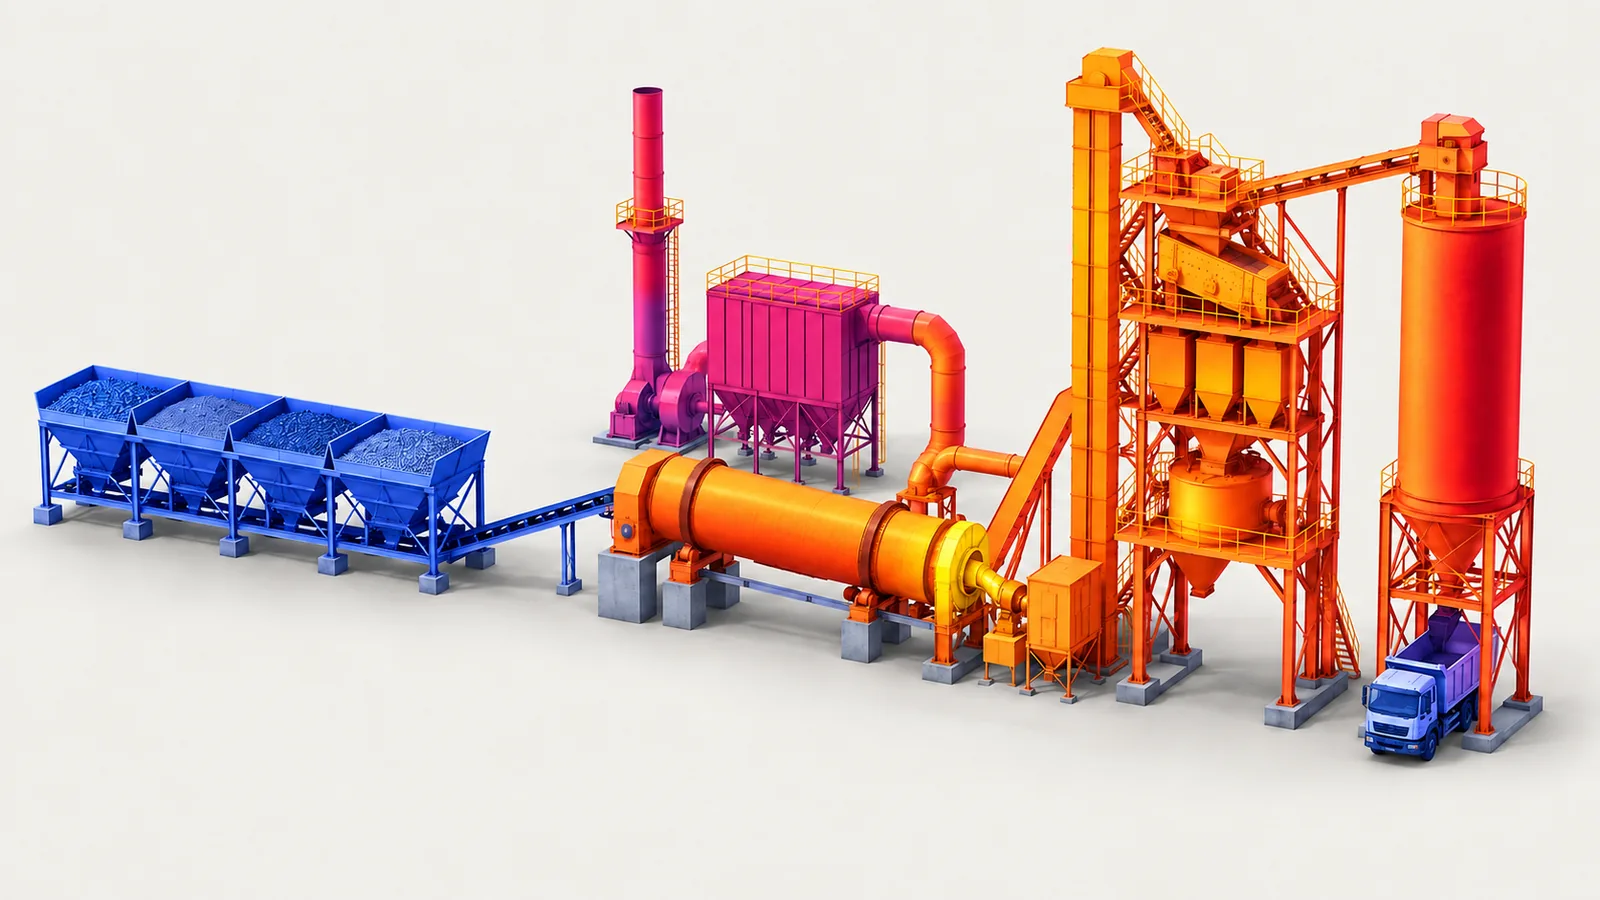
Batch Asphalt Plant
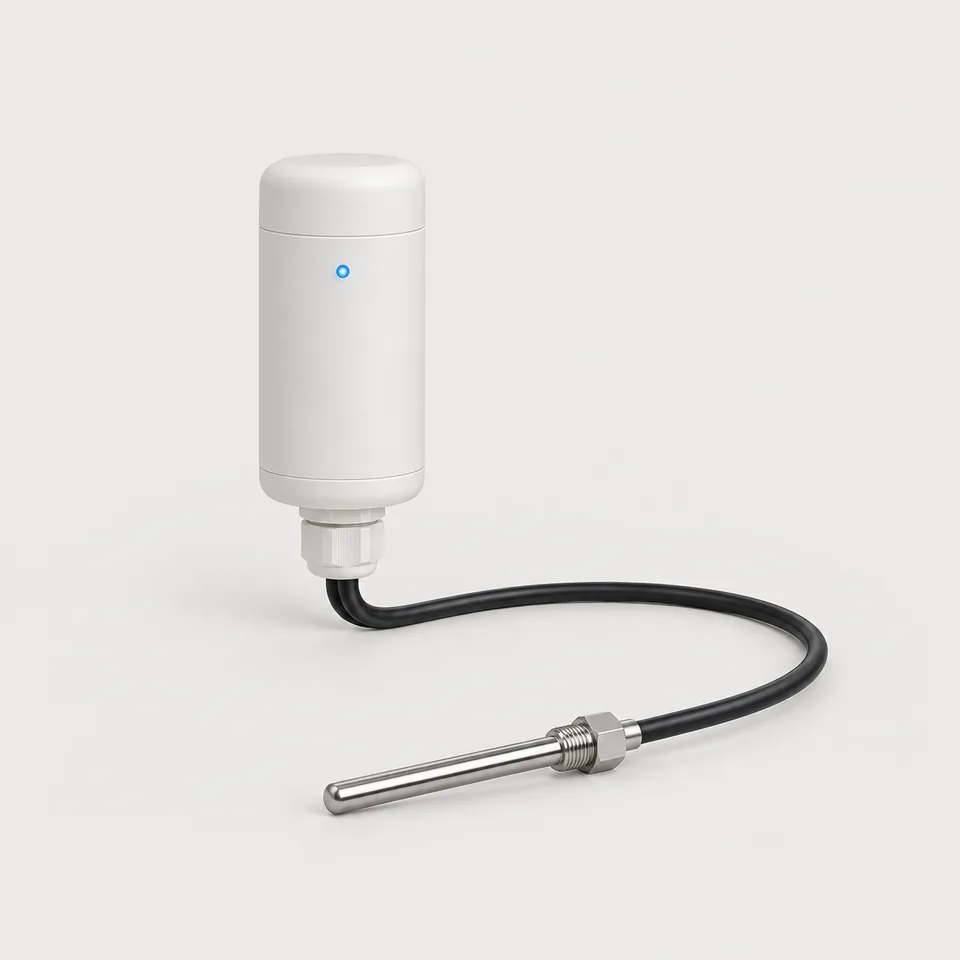
Process shows the flow and each machine's state. Heat colours every machine by temperature.
- S1 Mix in the Silo
- S2 Mix Discharge
- S3 Drum Shell, Hottest Point
- S4 Baghouse Inlet
Illustration. Temperatures are sample values within the limits VYROX Quarry checks.
3D Plant Model
Every machine of the batch plant where it really stands. Drag, zoom, click.
Process View
Material flow and each machine's state: running, warning or idle.
Heat and Energy View
Every machine coloured by temperature, from 30 °C to 190 °C.
Replay the Day
A time scrubber replays the day's stored readings.
Temperature Along the Path
From stone at air temperature to the mix at the paver.
Where the Energy Goes
The burner's heat per tonne: drying, heating and losses.
Dryer Efficiency and CO₂
Dryer efficiency and burner CO₂ per tonne, as a model estimate.
Every Truck, Checked
Load temperature, coldest corner and the predicted temperature at the paver.
Batch asphalt plants today. Drum plants next.
Thermal View of the Chain.
Loading the 3D plant…
Show Readings as a Table
| Machine | Reading | Value | Limit | Status |
|---|
Interactive demo. The plant and its readings are simulated; the limits are the ones VYROX Quarry uses.
What Feeds It.